We support and hire locally
We want to contribute to the sustainability of the communities where we operate. In 2013, we spent $1,015 billion (2012 - $579 million) with our top 25 suppliers of goods and services. Of this amount, $163 million, or 16%, (2012 - $75 million or 13%) was defined as local spending, in which the shipping destination and supplier site were both in the same jurisdiction.
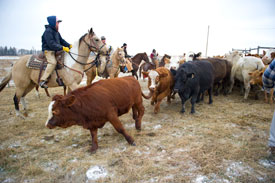 Local ranchers care for cattle that graze on Capital Power-owned land near the Genesee Generating Station in Alberta.
Contributing to the economy
Economic benefits from our business touch thousands of individuals and companies across North America and beyond, including equity and debt holders, local suppliers, governments, employees, energy producers, and investment banks.
The following interactive graphs paint a picture of the economic contributions made (and received) by Capital Power in 2013.